Ranking & Whitepaper of Global 50 Human Resource Service Providers, the most authoritative and most influential list of ranking global human resource services providers published by HRoot, the largest human resource media, every year. This is the 9th release. Companies of Ranking & Whitepaper of Global 50 Human Resource Service Providers are from 12 countries in the world and six industries which include talent...
MethodologyMethodology
- Conditions on entrants: The revenues of human resource service providers shall account for over 50% of their revenues, and the listed companies can provide financial data audited by third-party audits or notarized by the government departments. Therefore, listed companies such as Oracle, SAP, Kingdee, Yonyou are not presented as their software business did not generate more than 50% of their total revenues. Other companies such as DDI are absent from the rankings as they have not gone public or their financial data are not available, albeit they specialize in human resource services.
- The data adopted in the ranking come from below sources:
(1) Financial reports of 2017 announced by each listed company;
(2) Financial information of 2017 announced by the stock exchanges where the companies are traded;
(3) The data of unlisted companies are provided by third-party auditors or financial statements approved by the government departments available to HRoot.
(4) The list of operating income and operating profit data is mainly presented as an integer, in the same integer case, ranking order is still in accordance with the original data (without half adjust). - The annual financial data in the rankings are divided by the fiscal year involved in the financial reports rather than the calendar year.
- The rankings take the US dollar as the standard currency. Data are collected from https://www.ofx.com/en-us/forex-news/historical-exchange-rates/yearly-average-rates/. Financial data of non-US companies are converted into US dollars at the average exchange rate of a whole year ending on the last day of their fiscal years. The exchange rates are listed as follows: AUD1 to USD 0.7664; Euro1 to USD1.1277; GBP1 to USD 1.2875; CNY1 to USD 0.1480; JPY1 to USD 0.0089; SGD to USD 0.7243;South African rand to USD 0.0752; Polish zloty to USD 0.2648; Indian Rupee dollar to USD 0.0153.
- The slash mark, or "/", means no data.
- The financial data of Mercer are sourced from the 2017 annual financial report of its parent company, Marsh & McLennan.
- The financial data of Aon Hewitt refer to the Fiscal 2017 data of the HR solutions business of Aon Corporation.
- Persol Group was formerly named Temp Holdings.
- GATTACA was formerly named Matchtech.
- Total Revenue is the operating income of the companies in the sales of goods or services, and other operations, including the basic operating revenue and other operating income. It is an important part of corporate cash inflows, the operating results of the enterprise. Therefore, the rankings refer to the total revenue of the enterprises.
- The data of industry averages are calculated as per the industry categories the 50 companies fall into, i.e., talent dispatch/lease/placement services, executive search services, recruitment process outsourcing, human resource outsourcing,human resource management software, human resource consulting, and online recruitment.
- Interpretations of financial ratios:
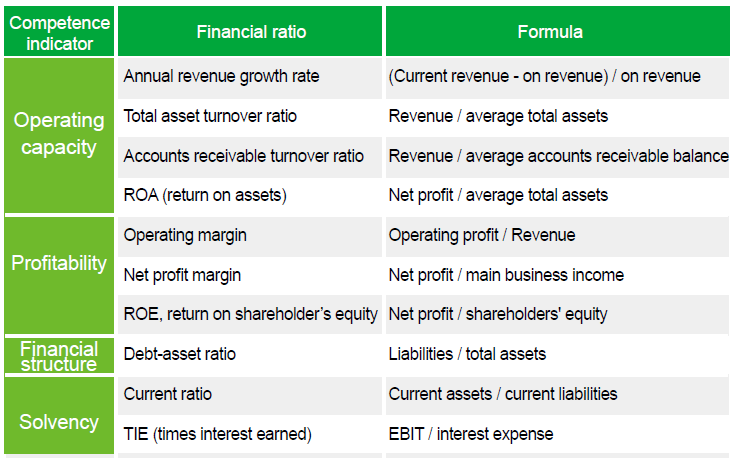
(1) Annual revenue growth rate gauges the ratio of the difference between the revenues of Fiscal 2018 and Fiscal 2017 to the latter. It illustrates how fast the revenue is changing.
(2) The total asset turnover ratio measures the ability of a company to use its assets to efficiently generate sales. This ratio considers all assets, current and fixed. Those assets include fixed assets, like plant and equipment, as well as inventory, accounts receivable, as well as any other current assets. The fast the turnover of a company, the stronger its operating capacity is.
(3) Accounts receivable turnover ratio refers to the number of times that accounts receivable amount is collected throughout the year. The average accounts receivable looks at the accounts receivable balance at the beginning of the year as well as the end of the year. A high accounts receivable turnover ratio indicates a tight credit policy. A low or declining accounts receivable turnover ratio indicates a collection problem, part of which may be due to bad debts. Yet an extremely high ratio can mean that the company is under the heavy debts that may curb the increase of its sales amount and profit.
(4) ROA, or return on assets, is an indicator of how profitable a company is relative to its total assets. ROA gives an idea as to how efficient management is at using its assets to generate earnings. Calculated by dividing a company's annual earnings by its total assets, ROA is displayed as a percentage.
(5) Operating margin is a measure of profitability that indicates how much of each dollar of revenues is left over after both costs of goods sold and operating expenses are considered.
(6) Net profit margin tells how much profit a company makes for every one dollar. The higher a company's profit margin compared to its competitors, the better.
(7) ROE, or Return on shareholder's equity, is the amount of net income returned as a percentage of shareholders equity. Return on equity measures a corporation's profitability by revealing how much profit a company generates with the money shareholders have invested.
(8) Debt-asset ratio is total liabilities divided by total assets. The debt asset ratio shows the proportion of a company's assets which are financed through debt. Companies with high debt/asset ratios are said to be "highly leveraged," and could be in danger if creditors start to demand repayment of debt.
(9) Current ratio suggests the company's ability to pay back its short-term liabilities (debt and payables) with its short-term assets (cash, inventory, receivables). The higher the current ratio, the more capable the company is of paying its obligations.
(10) Multiples of interest earned is a metric used to measure a company's ability to meet its debt obligations. It is calculated by taking a company's earnings before interest and taxes (EBIT) and dividing it by the total interest payable on bonds and other contractual debt. It is usually quoted as a ratio and indicates how many times a company can cover its interest charges on a pretax basis. The higher the TIE, the more ability the company has to pay its long-term debts.
- The column of "Ranking higher/lower" illustrates with signs, of which an upward arrow means the company ranks higher than before and a downward arrow means the opposite; a bar means staying unchanged while an arrow pointing right means the company is a new entrant to the rankings.