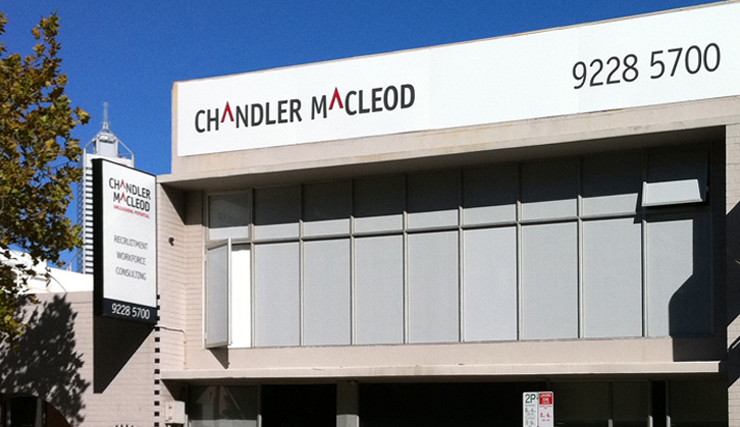
|

| Company name in Chinese: |
/ |
Company name in English: |
CHANDLER MACLEOD |
| Headquarters: |
Sydney, Australia |
Country: |
Australia |
| Established: |
1959 |
Website: |
http://www.chandlermacleod.com |
| Main Business: |
Outsourcing |
Annual revenue of 2013: |
1,504 million dollars |
| Stock Exchange: |
Australian Securities Exchange |
Stock Code: |
CMG |
| About: |
 CHANDLER MACLEOD(ASX:CMG) is engaged in the business of human resource (HR) outsourcing, recruitment and consulting services. As of June 30, 2010, it offered complete and fully integrated recruitment and HR outsourcing services across blue-collar, white-collar, executive and professional recruitment and contracting. It also offered consulting services encompassing psychometric assessment, management, organisational development, executive coaching, outplacement, career transition, talent management, and redeployment. Its segments consist of: Workforce, which includes ready workforce, for staff aviation, Chandler Macleod health, providing tradespeople, semi-skilled and unskilled labour recruitment for the industrial sector; Recruitment that provides permanent and temporary recruitment services; Consulting that provides HR consulting and training; OCG, which is a New Zealand-based white collar and information technology provider, and CMyPeople, which is a web enabled assessment tool. CHANDLER MACLEOD(ASX:CMG) is engaged in the business of human resource (HR) outsourcing, recruitment and consulting services. As of June 30, 2010, it offered complete and fully integrated recruitment and HR outsourcing services across blue-collar, white-collar, executive and professional recruitment and contracting. It also offered consulting services encompassing psychometric assessment, management, organisational development, executive coaching, outplacement, career transition, talent management, and redeployment. Its segments consist of: Workforce, which includes ready workforce, for staff aviation, Chandler Macleod health, providing tradespeople, semi-skilled and unskilled labour recruitment for the industrial sector; Recruitment that provides permanent and temporary recruitment services; Consulting that provides HR consulting and training; OCG, which is a New Zealand-based white collar and information technology provider, and CMyPeople, which is a web enabled assessment tool. |
Major financial data in Fiscal 2013(Unit: $ million)
| Operating profit |
Net profit |
Pre-tax profit |
Shareholders' equity |
| / |
11 |
/ |
155 |
| Total assets by the end of 2013 |
Average total assets |
Current assets |
Current liabilities |
| 368 |
368 |
117 |
104 |
| Receivable by the end of 2013 |
Average receivable |
Total liabilities |
Interest expense |
| 118 |
163 |
212 |
/ |
Major financial ratios in Fiscal 2013:
| Indicator |
Ratio |
Compared with industry average |
Indicator |
Ratio |
Compared with industry average |
| Revenue growth rate |
-2.9% |
Lower |
Net profit margin |
0.7% |
Lower |
| Total turnover ratio |
4.1 |
Higher |
ROE |
7.2% |
Lower |
| Accounts receivable turnover ratio |
9.2 |
Lower |
Debt-asset ratio |
57.6% |
Lower |
| ROA |
3.0% |
Lower |
Current ratio |
1.1 |
Lower |
| Operating margin |
/ |
/ |
Times Interest Earned |
/ |
/ |
|

